Jacob Schwartz Scientist & HTML fan
OpenRCT2 operations research: how many mechanics should I hire?

OpenRCT2 breathes new life into a classic game
A few months ago I learned about OpenRCT2, an open-source re-implementation of the RollerCoaster Tycoon 2. Now that my PhD is done I have a bit more free time, and I tried out the game. With the help of videos by Marcel Vos and Deurklink, I’ve been able to improve my scenario play by correctly pricing rides. With so much profit ($10000+/hour) from a single ride, I mused: should I hire a mechanic dedicated to keeping this one ride working? Or is it still more profitable to hire just one mechanic for multiple rides?
In order to answer this, I learned a smidge of queueing theory and explored a model of the system using python. The code associated with this post is available on github.
It turns out that in order for it to be profitable to have one dedicated mechanic for a ride, it would need to earn about 100000/hour, which is extremely high. Below, I introduce a bit of queueing theory. Then, I explain how I made this assessment, and finally I extend the model to allow for decisions between arbitrary numbers of rides per mechanic.
Queueing: not just for guests
Queueing theory is a branch of mathematics and operations research that studies, well, queues. It can be used to study the wait times of entities (‘customers’) in a queue, or the utilization of one or more servers. For this application, the ‘customers’ are broken rides, and the servers are the mechanics. I’m not discussing the queues that guests are waiting in! Perhaps that could be discussed another time.
There are many models of queues that one can study, and the common ones are given shorthand names. The most important parameters are the distribution of arrival times of the customers, $A$; the distribution of service times one a customer reaches the head of the queue, $S$; and the number of servers $c$. These are abbreviated as $A/S/c$. The simplest choice for $A$ and $S$ for analysis is often the Poisson distribution, here called Markovian or memoryless and abbreviated as M. Alternately, a process might be better modeled as a degenerate distribution, i.e., a fixed time between arrivals or a fixed service time. This is abbreviated as D. So, a M/D/2 queue is one where customers arrive randomly with the time between arrivals described by a Poisson distribution, each customer requires a fixed service time, and there are two servers. This model turns out to be relative simple to analyze, but it’s not exactly what we need: in this model, there’s no limit to the amount of customers in the queue, and there’s no finite amount of total customers (in the world outside the queue).
Queueing complication: finite numbers of customers
The shorthand notation can also describe situations with only finite numbers of slots in the queue (if a queue is filled, customers fall overboard I suppose!) or situations with only finite numbers of total customers in the world. These are written as fourth and fifth slots; for example M/D/1/2/5 describes one server, two slots, and a total ‘calling population’ of 5. (Footnote: the term ‘calling population’ refers to telephone calls; queueing theory was developed by an early telephone system engineer!)
The situations: two coasters, one or two mechanics
We’ll compare two situations: in the first, two rollercoasters are serviced by two mechanics. In the second, the two coasters are serviced by just one mechanic. We assume
- these are the only two rides that can break.
- times between breakdown of each coaster are sampled from an exponential distribution, with equal breakdown frequency $\lambda$.
- mechanics take a constant time to fix a coaster once it breaks, $t_\mathrm{fix}$.
- the two coaster income rates $I_{\mathrm{RC}}$ are equal. No income is earned while the coaster is broken.
- mechanics cost a fixed amount per unit time $C_\mathrm{mech}$.
The first situation is equivalent to two copies of an M/D/1/1/1 model. The second is equivalent to one M/D/1/2/2 model.
Solution of M/D/1/1/1
This situation is easy to model. The system toggles between the state with the rollercoaster operating, for a mean time period $1/\lambda$, and a state with the coaster broken, for a time period $t_\mathrm{fix}$.
Overall, the coaster is working for an average of
\[\frac{1/\lambda }{1/\lambda + t_\mathrm{fix} } = \frac{1}{1 + \lambda t_\mathrm{fix}}.\]The income from the two coasters is $2 I_\mathrm{RC} / (1 + \lambda t_\mathrm{fix})$ and the two mechanics cost $2 C_\mathrm{mech}$, for a total rate of income of
\[I_1 = 2 I_\mathrm{RC} / (1 + \lambda t_\mathrm{fix}) - 2 C_\mathrm{mech}.\]For M/D/1/2/2, an approximation is needed
Unfortunately I’ve been unable to find an analytic solution for the second situation, M/D/1/2/2. There’s two ways we can go from here: the first is to alter the model so that there is an analytic solution, and the second is to write a simulation to compute a numerical solution. In this post I’ll explore the first method.
“Pray I don’t alter it any further”
In order to make the model tractable, we change the repair time from a constant $t_\mathrm{fix}$ to a sample from an exponential distribution with mean $1/\mu = 1/t_\mathrm{fix}$. The average time to fix one ride remains unchanged.
Now we have a M/M/1/2/2 model. This is a continuous-time Markov chain model, and can be represented by the graph shown in Figure 1. Each bubble in the graph represents a number of rides the mechanic needs to fix.
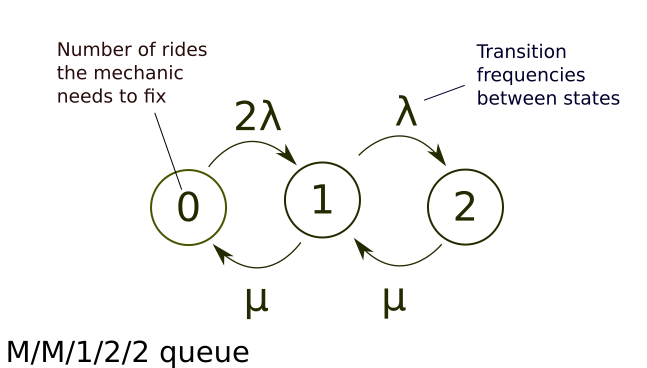
The matrix that describes the transitions between the states is
\[Q = \begin{bmatrix} -\mu & \mu & 0 \\ 2 \lambda & -(2 \lambda + \mu) & \mu \\ 0 & \lambda & -\lambda \end{bmatrix},\]where you can see the off-diagonal entries correspond to the frequency of transition from column to row.
The steady-state solution for the probabilities $P_n$ that $n$ rollercoasters are broken is given by $\pi Q = 0$, where $\pi$ is the row vector $\left(P_0, P_1, P_2\right)$. This example with two rollercoasters is fairly easy to solve by hand, but we can also look up the general solution (see the last slide). In the below formulas, for a more general M/M/c/K/K model, $c=1$ is the number of mechanics, and $K$ is the number of coasters.
\[P_0 = \left[ \sum_{n=0}^{c-1} {K \choose n} \left(\frac{\lambda}{\mu}\right)^n + \sum_{n=c}^K \frac{K!}{(K-n)!c!c^{n-c}}\left(\frac{\lambda}{\mu}\right)^n\right]^{-1}\] \[\text{for $n<c$, } P_n = {K \choose n} \left(\frac{\lambda}{\mu}\right)^n P_0\] \[\text{for $c \le n \le K$, } P_n = \frac{K!}{(K-n)!c!c^{n-c}}\left(\frac{\lambda}{\mu}\right)^n P_0\]Evaluating these with $c=1$, $K=2$, we find
\[P_0 = \frac{1}{1 + 2 \left(\lambda/\mu\right) + 2 \left(\lambda/\mu\right)^2}\] \[P_1 = \frac{2 \left(\lambda/\mu\right)}{1 + 2 \left(\lambda/\mu\right) + 2 \left(\lambda/\mu\right)^2}\] \[P_2 = \frac{2 \left(\lambda/\mu\right)^2}{1 + 2 \left(\lambda/\mu\right) + 2 \left(\lambda/\mu\right)^2}\]The income from the two coasters is $2 I_\mathrm{RC} P_0 + I_\mathrm{RC} P_1 + 0 P_2$, and the mechanic costs $C_\mathrm{mech}$, so the total rate of income is
\[I_2 = I_\mathrm{RC} \frac{2 + 2(\lambda/\mu)}{1 + 2 \left(\lambda/\mu\right) + 2 \left(\lambda/\mu\right)^2} - C_\mathrm{mech}\]One or two mechanics?
In this approximation, you make more money hiring the one mechanic per ride when $I_1 > I_2$. Substituting in each expression yields
\[\frac{2 I_\mathrm{RC}}{1 + \lambda / \mu} - 2 C_\mathrm{mech} > I_\mathrm{RC} \frac{2 + 2(\lambda/\mu)}{1 + 2 \left(\lambda/\mu\right) + 2 \left(\lambda/\mu\right)^2} - C_\mathrm{mech}.\]We can simply these equations by defining $x \equiv \lambda/\mu$ and $y \equiv I_\mathrm{RC}/C_\mathrm{mech}$, yielding
\[\frac{2 y }{1 + x} - 2 > y \frac{2 + 2x}{1 + 2 x + 2 x^2} - 1,\]which simplifies to
\[y > \frac{1}{2 x^2} + \frac{3}{2x} + 2 + x.\]This curve is plotted in the figure below.
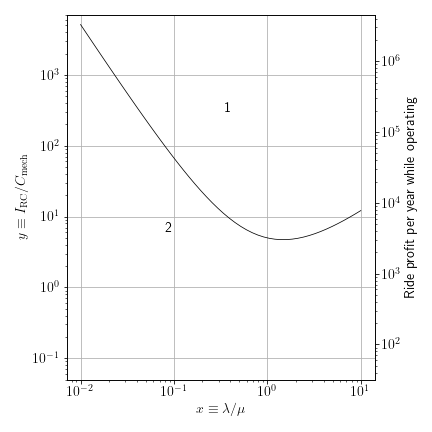
Since mechanics always cost 80/month = 640/year, the right y-axis shows required ride profits in monetary units per year.
Where do typical rides fall on this plot?
Typical breakdown frequencies for new rides might be 2-4 times per year, and typical times to repair are perhaps 3-8 game days. With about 245 game days per year, $x$ then typically from 0.025 to 0.13. At the high end of this range, it could be profitable to have a dedicated mechanic if a ride earns more than 30000/year. This is large but plausible: the compact air-powered-vertical showcased by Vos could earn on the order of twice that.
Generalization to many rides per mechanic
The above equations for the M/M/1/K/K system allow us to compare choices of arbitrary numbers of rides per mechanic. The figure below shows the dividing lines between the most profitable choices of $K$, for $K$ being a Fibonnaci number. (It’s easy enough to make one of these plots for every integer, but then the lines are spaced very closely.)
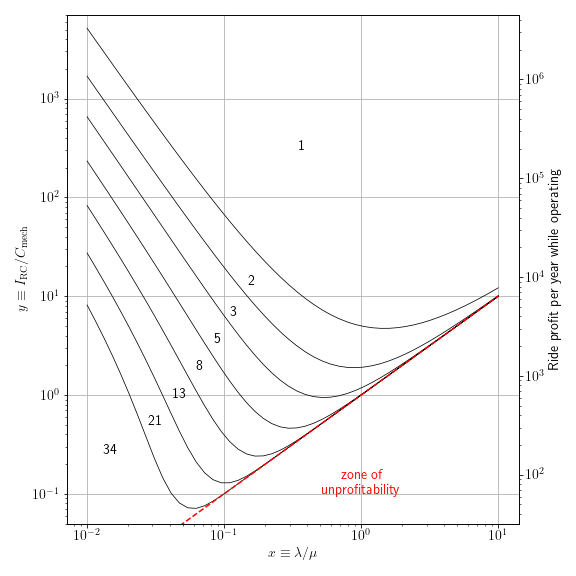
If you have a collection of rides that each earn 10000/year, break down three times a year, and take about 5 days to fix, then you should consider allocating one mechanic per 5 rides rather than per 3 or per 8.
Conclusion
This is a fairly simplistic model: it only handles collections of rides that make the same amount of money break down with the same frequency, and where the rides are spaced such that mechanics take the same amount of time to service all of them. It also treats the time to fix a ride as being drawn from an exponential distribution.
However, this gives some insight on the dynamics at play, and can roughly suggest a number of mechanics that should be allocated for a set of high-profit rides.
Written on August 31st , 2020